

Not too long ago, I was (and still am) challenged with analyzing deadlocks at a specific customer. And in all honesty – that was not easy, because, you know, deadlocks is something on SQL – and it’s not like we have a lot of access to SQL tools.
What are deadlocks?
I’m not going to lie – I can’t explain it better than Wikipedia does 🤪:
In concurrent computing, deadlock is any situation in which no member of some group of entities can proceed because each waits for another member, including itself, to take action, such as sending a message or, more commonly, releasing a lock. Deadlocks are a common problem in multiprocessing systems, parallel computing, and distributed systems, because in these contexts systems often use software or hardware locks to arbitrate shared resources and implement process synchronization.
Wikipedia
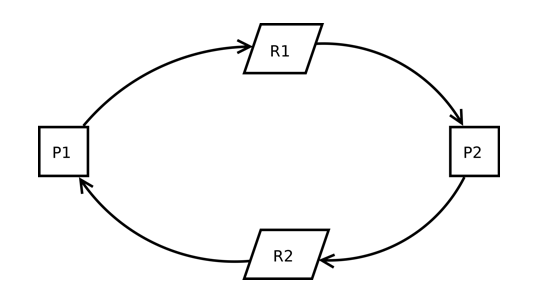
So, in other words: it’s a common problem in a multi-user environment, where processes are locking each other indefinitely, like:
process 1 is requires a lock on resource 1, and locks resource 2, while process 2 requires a lock on resource 2 and is locking resource 1.
Long story short: SQL Server will “kill” one process, which releases the lock for the other process. The killed process errors out.
Or in other words: it’s different processes locking the same resources in a different order, where SQL server chooses which process to kill.
Deadlock Monitoring
You already guessed: analyzing deadlocks is a matter of monitoring “enough” deadlocks, figuring out the process, analyzing the process (locking order) and try to make good decisions on solving them.
And Microsoft has your back:
- Monitoring SQL Database Deadlocks – Business Central | Microsoft Learn
- Database Deadlock Lock Trace Telemetry – Business Central | Microsoft Learn
The first link mostly handles on how to do this on SQL Server. The second is using Telemetry. What I will cover further along in this post, is how we are approaching it. Obvious disclaimer: what works for us might not work for you, and visa versa ;-).
PowerBI Overview
First of all – Microsoft (Kennie) has put a lot of time and effort in putting together a PowerBI app that lets you analyze the bejeezes out of telemetry .. Including deadlocks!
More info here: Analyze and Monitor Telemetry with Power BI – Business Central | Microsoft Learn
And you can see something like this:
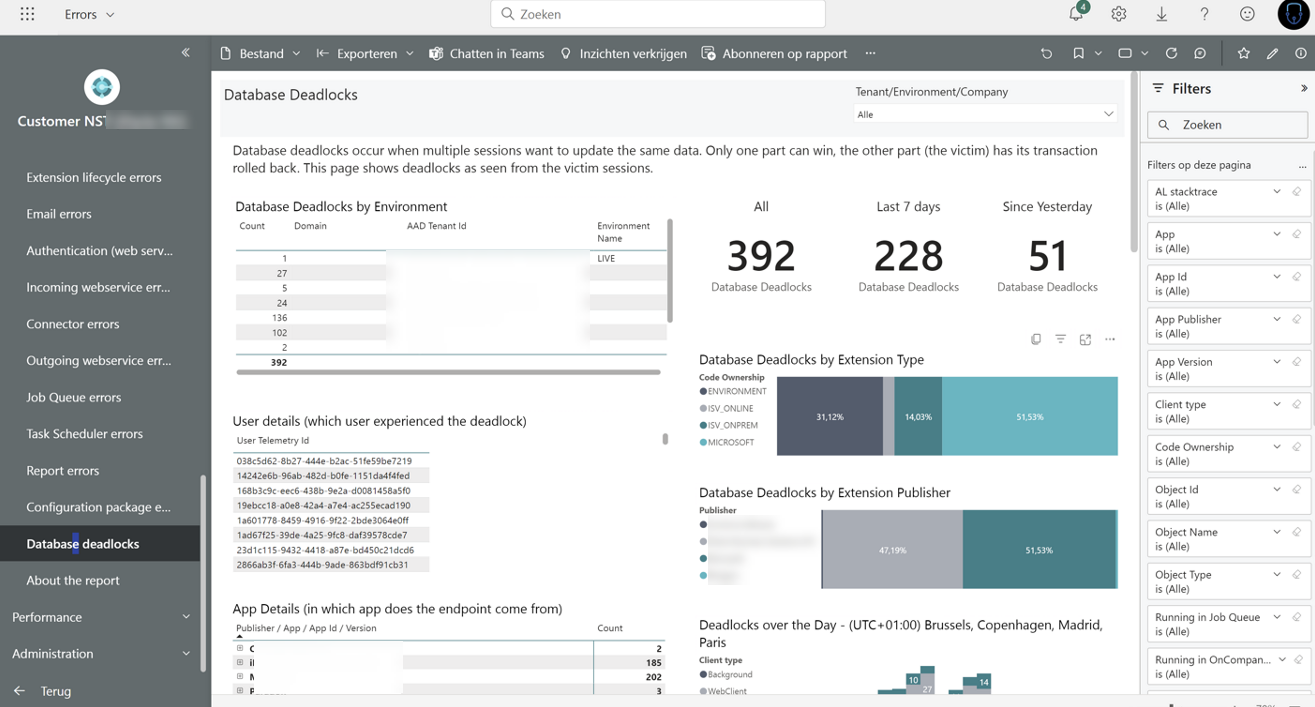
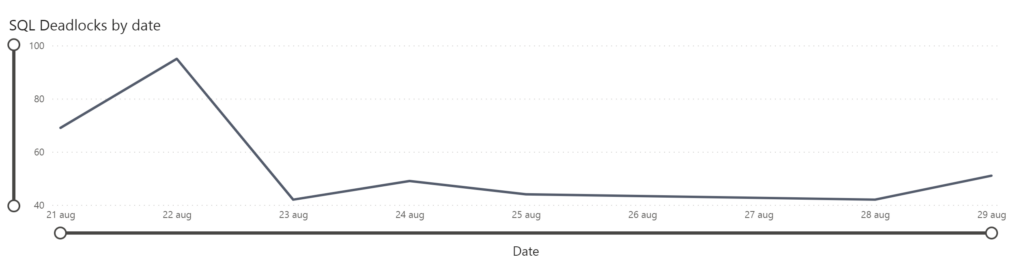
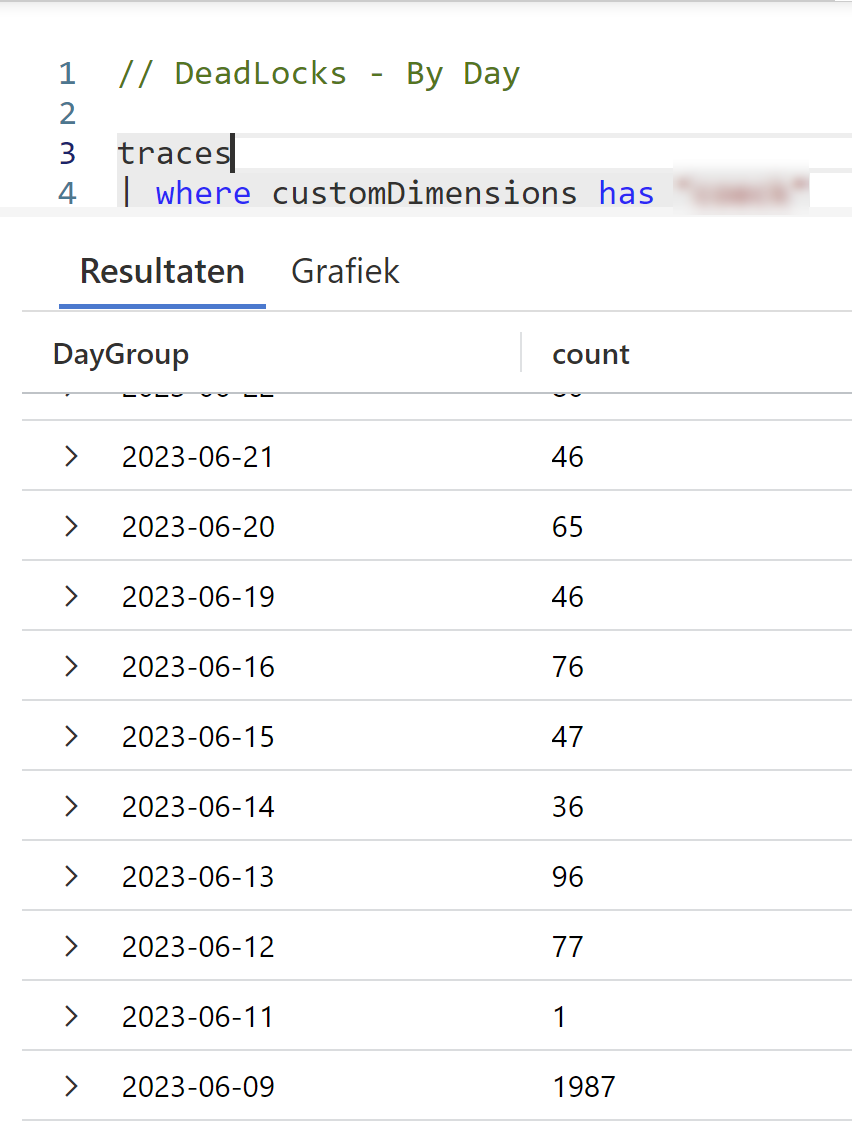
Frankly, I get lost in the visualizations and filtering, so I haven’t been using this much. Although, I have been occasionally looking into the “Deadlocks by date” graph:
Some KQL
I mainly used KQL, because that was a bit easier to work with, to analyze and so on. Again: it might not be true for you.
What I wanted to do, was to capture basically two things:
- What processes are involved in deadlocking – later, I could analyze these processes, look into locking order and so on. But step 1 is always: which processes??
- What objects (tables / queries / …) are involved in the deadlock. Just think about it: may be it’s just one table that causes all the pain. I remember that one of our pain points was the No series table. Which made our first improvement a really easy one: turn on the “Allow Gaps in No. Series” ;-).
But again – step 1 is..
List the processes that needs some careful analysis.
If you read one of my previous posts, you might have figured I added some scripts to my github repo for BC Telemetry. Let me go over a few of them.
It’s good to have an overview of customers to know which customers are out of line, and really need immediate attention. You could say, when there is a customer with more than a certain amount of deadlocks in a month, send a notification.
Just look at this output “from a friend” 🤪 – there are clearly some customers that are out of line, don’t you think?
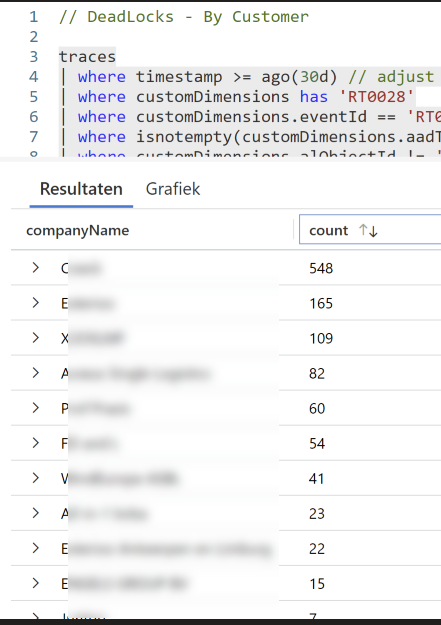
I’ll let him know.. ;-).
Once you identified which customer needs attention it’s time to analyzed the processes. When you look close to the data you get from signal RT0028, you see that you get really good info. What I need is all there:
- Callstack
- SQL Query
- Object info
Just take the callstack for example: the bottom of the callstack is where it all starts – which is a very nice indicator of “the source process”, while the top of the callstack indicates where the process errors out: the locking object. Kennie was nice enough to share some KQL to get this info out of the callstack, so I pasted that in my queries ;-).
So, this query kind of gives you an overview, by SourceProcess (bottom of the callstack), and by locking object, how many times there was a deadlock. Here is an example:
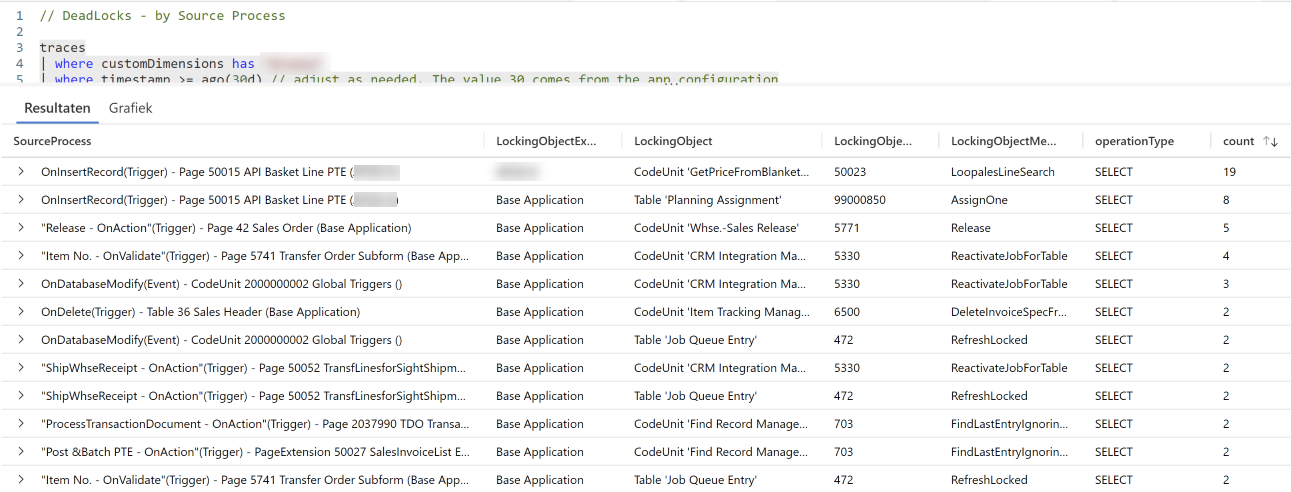
So – it this example, it seems that most deadlocks occur on a custom page, on two different locking objects. That gives you a very clear indication in which direction you need to go, of course! You have an object, you have triggers, and a place in code that causes the issue.
Though – the previous query gives you which processes cause the deadlocks – but – we know that there are at least two processes involved, which are trying to lock the same resource. So it’s also interesting to look at the same kind of query, but grouped on the locking object. And then see if there is more than one process that ended up in our telemetry.
In this query, you see that you have multiple occasions for a certain locking object.
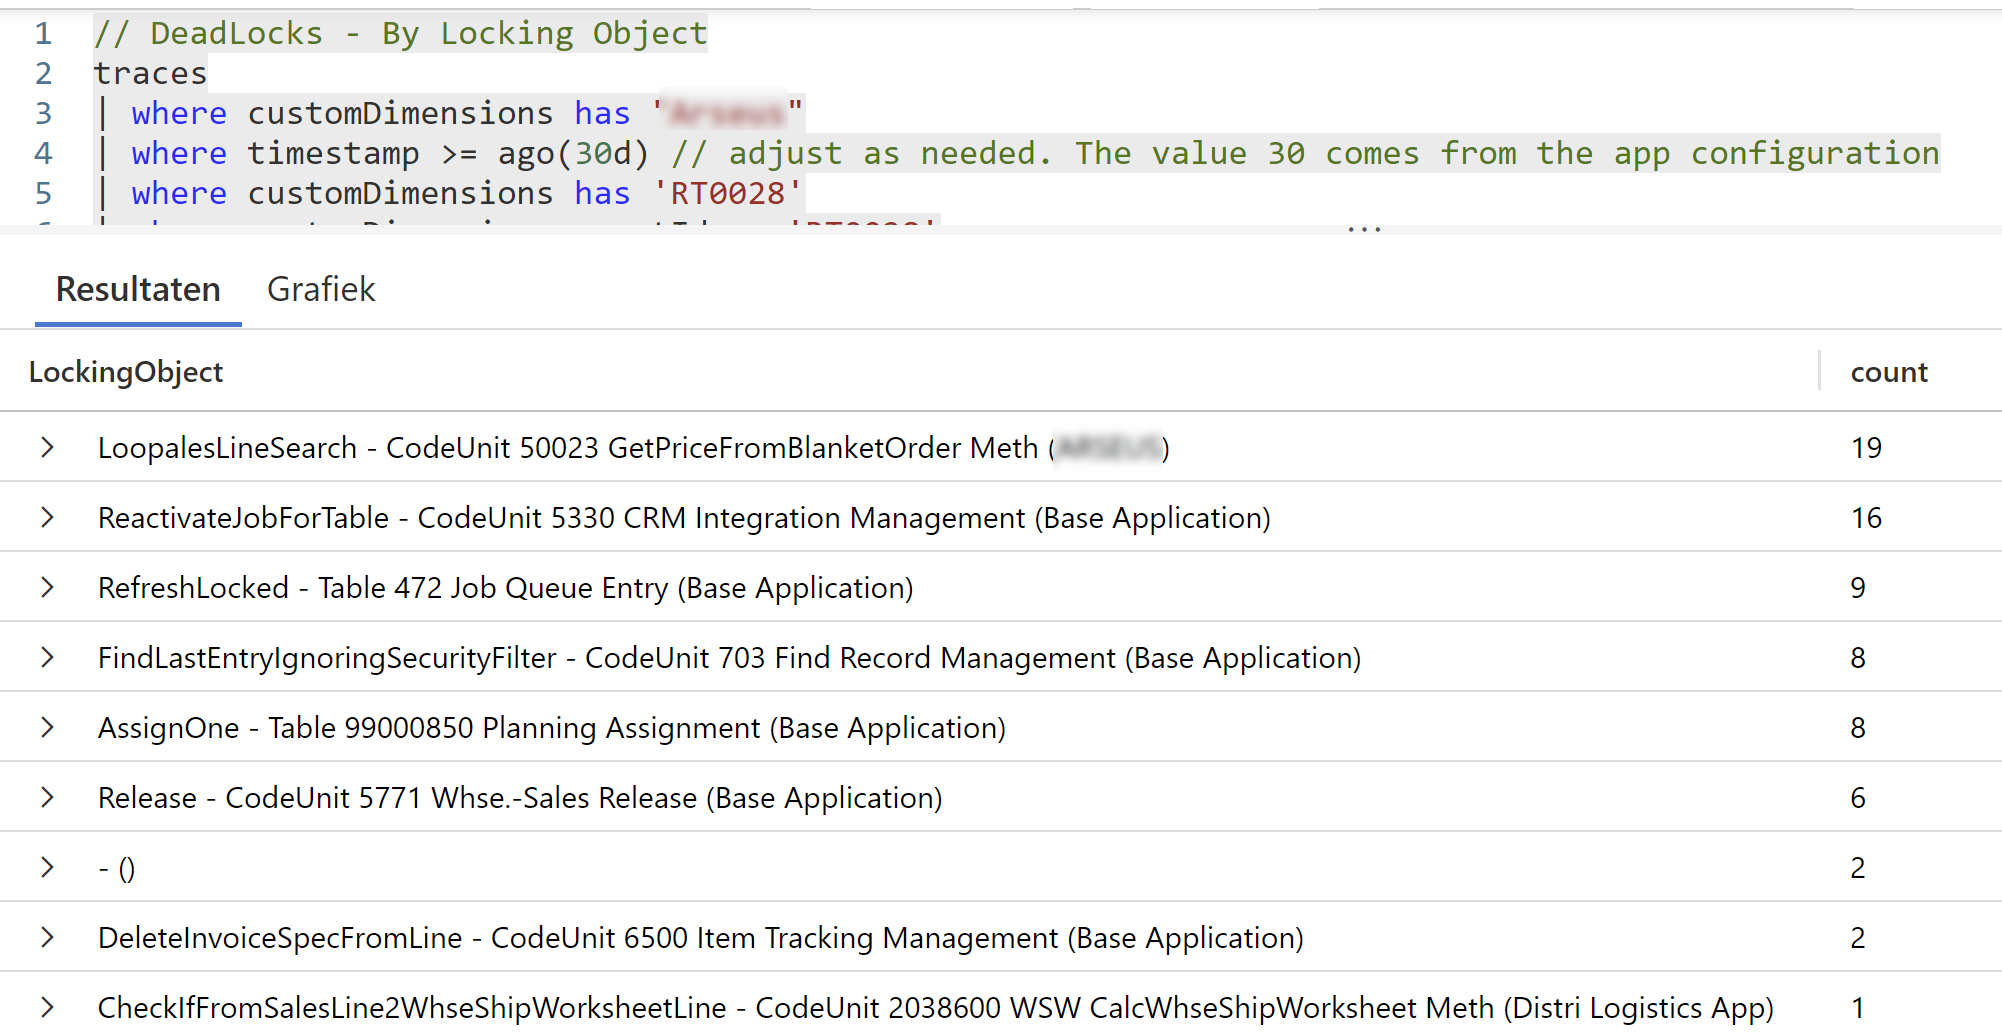
And you can already see how you can use all these KQL queries, to figure out the different combinations of processes and objects that you should look into.
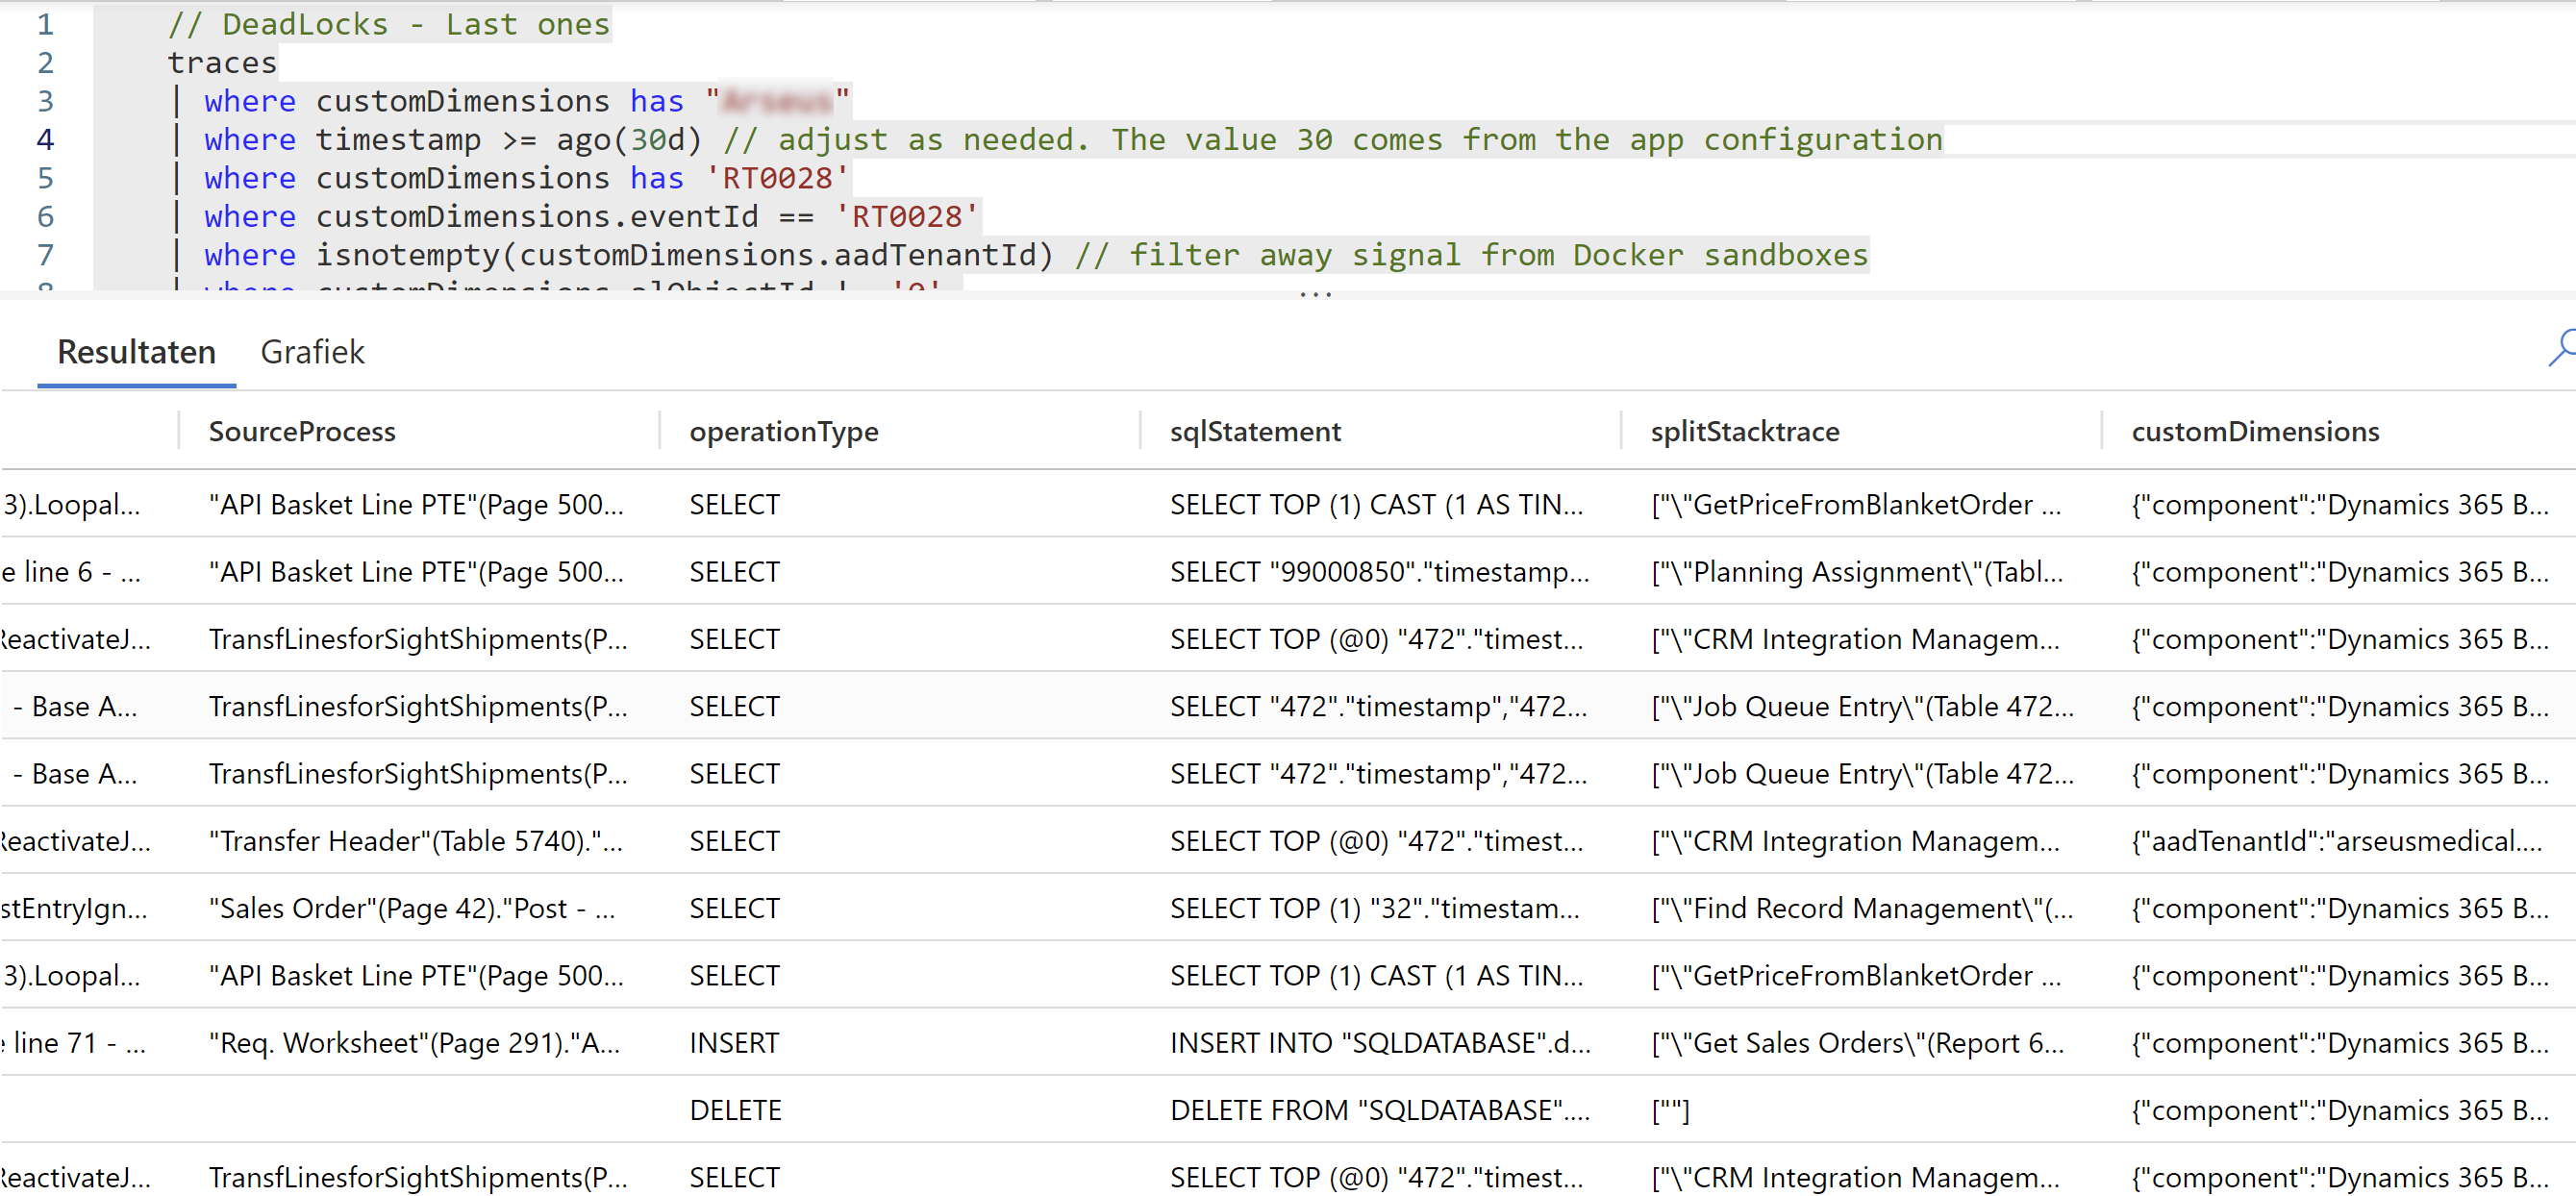
Last but not least, I needed a query to give me all the details I needed. As a base, I used this “Last Deadlocks” query, which simply gave me all occasions of all deadlocks at a certain point in time at a customer, the sqlstatement, the source process, locking object, but also the complete callstack and so on. Let’s call it a “base query” which I could always use to go into detail, filter, custom groupings and whatnot .. to really get to the bottom of the issues.
When you’re actively working on deadlocks, it’s nice to give an overview to a customer to show the progress. We used this query for that. I can’t show you decent output, except for this extreme example 🤪
ReadIsolation
While we were working on these issues, some statements really stood out to me. Like we were having deadlocks on CALCSUMs and on ISEMPTY statements, which are easily identifiable from sqlstatements and callstack thanks to the KQL above.
This made me wonder. Obviously, when we talk about deadlocking, we are also talking about locking. And even for these rather simply queries that I think should never lock (this is something I still have to think through, though – so if you have an view on that, please share in the comments below ;-)) – we really need to pay attention to ANY kind of read statement in AL.
Which brings me to my favorite new feature lately: the ability to set ReadIsolation in AL to have much more control over what you want to lock, and more important, what you DON’T want to lock! I can very much recommend this BCTechDays session for you to get deeper into that:
I wasn’t able to put it into practice at my customers yet, but I really think that the ability to set ReadIsolation will make it so much easier to solve unnecessary deadlocking
2 comments
2 pings
Nice article, but the telemetry only enables us to look at the victims of deadlock. Shouldn’t we consider all involved processes of a deadlock as equally part of the problem and potential targets for a solution?
Way back in NAV we had the Client Monitor Tool, which enabled us to configure a lock order and get warnings if the lock order wasn’t followed. (I know, it made more sense before we got row level locking, but it would still be very valuable today)
I’m both missing a tool like that, but more importantly: I miss the guidelines Microsoft use to decide locking order in their code. Without knowing exactly which locking order they are aiming at, it is almost impossible to lock in the same order in our code.
Do you have their guideline or do you have a recommended order of locking?
Author
All true. I just wanted to show the tools that helped me – and that would also work in the cloud.
I’m aiming for analyzing with “enough data” to try to figure out all processes, while realizing it only reports 1 (the victim). Enough data = monitoring. I would not try to look into deadlocking after just a few days of data in Telemetry…
[…] Analyzing Deadlocks in Business Central with Telemetry […]
[…] écrivant sur son blog, Waldo, alias Eric Wauters, a déclaré qu’il n’y a pas si longtemps, il était (et est […]