

I’ve been working with Business Central Telemetry a lot the last coulple of months, having to deal with deadlocks and such. And while doing so, quite some new ideas came to mind that I’d like to investigate by means of Telemetry.
But first, a disclaimer
I’m absolutly not an expert. Probably there are better ways for everything I’m doing, and please, let me know if there are! I’m a fan of scripting, I’m a fan of fast running queries giving me fast results .. and since a few months, that made me fan of reading, using and learning from the KQL samples on Microsoft github as well.
SetLoadFields
When you followed one of my Coding4Performance workshops, you must have noticed I’m also a big fan of “Partial Records“.
Well, one of the ideas was to try to discover instances in our code (products, PTE’s, doesn’t really matter ..) where we forgot, or at least has a high possibility or opportunity to implement a SetLoadFields in code, and therefor speed up your code.
When reading Microsoft’s samples on GitHub, I saw that it simply counted the JOINs in the sqlStatements of some of the queries. That is obviously very interesting to know in terms of “partial records”.
So why not:
Whatever SELECT statement of whatever telemetry event contains information whether it has too many joins or not. Even more: if it’s even no join, it also contains how many columns you have selected. Also, when the telemetry event contains a callstack, you know there is some AL code involved you could analyze and maybe improve. If you then would be able to see if it’s in one of your extensions, then there is something you can do about it 🤷♂️.
In the next part, I’m going to focus on the number of joins, but do know I included the number of columns in the scripts as well!
The result
I created 4 queries that help me analyze all this, which you can find here: waldo.BCTelemetry/Performance/PartialRecords at master · waldo1001/waldo.BCTelemetry · GitHub
- ManyJoins – Base Query: this is the query with “all” (let’s say, “interesting”) details: one record is one event that happened at some point in time. You can see that I’m not really interested in one or more eventIds. In stead, I’m interested in ALL of them, with a SELECT sqlStatement, and with an AL callstack. And .. no pages, as I simple can’t influence how a page gets its data too much (can I?).
- ManyJoins – By Extension: This one is based on the one above, but summarizes the data by Extension, so you can have an idea which is “the low hanging fruit app” to work on.
- ManyJoins – By Object: Again a summarize, but this time by Object.
- ManyJoins – By Table: and this one by table, if at all interesting. I think it is, like you don’t want to have “partial records” issues on high demanding tables.
Now, I basically have all the angles that I’d want to look at for investigating “partial records” in my apps. For example, I can run the “By Table” query, which could have this result:
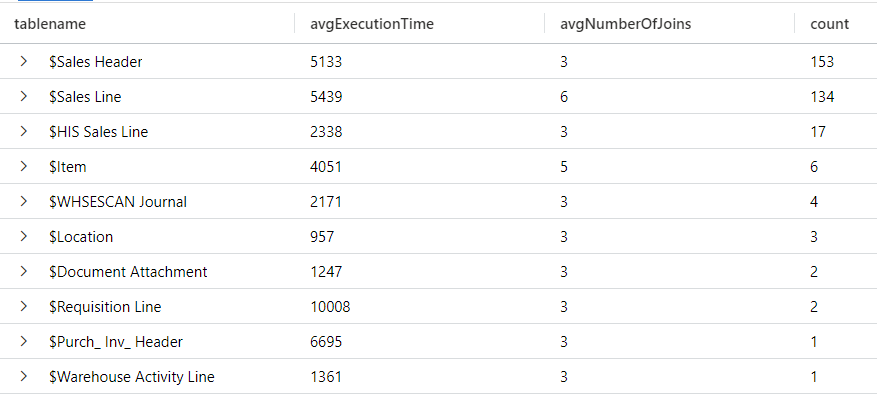
(Results “from a friend” 🤪)
May be, the average of 6 joins is interesting on Sales Line, so let’s see that in combination with the “By Extension” query, where I can add the filter
| where tablename == "$Sales Line"After the project.
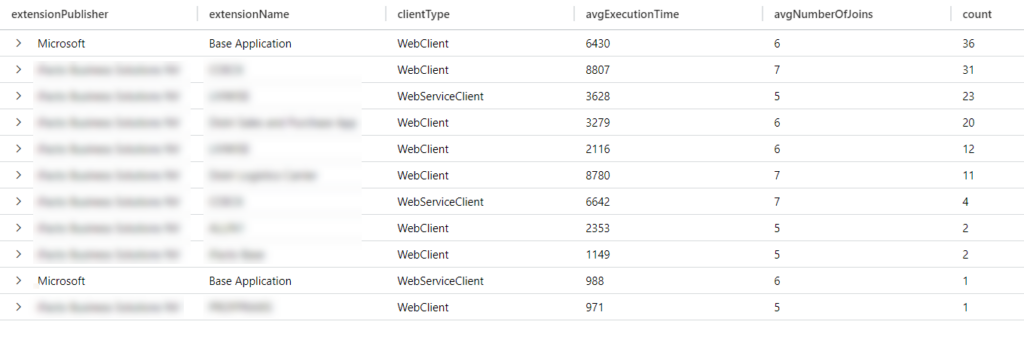
Which kind of tells me that Microsoft’s extension does send most of the unpartial queries – but there are also quite some that I can work on.
So I do the same with the “By Object” query, so I know where all these instances come from, and where to improve my code:
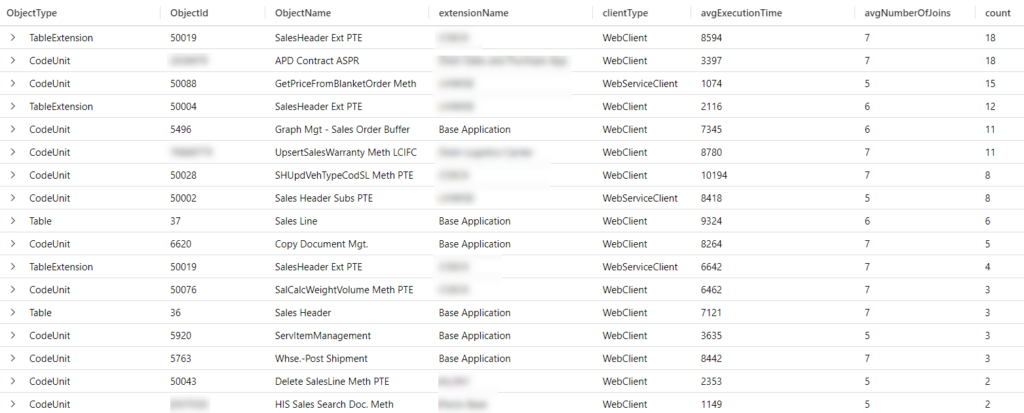
You see, with some smart filtering, it’s quite easy to drill down to the actual place in code to implement improvements.
Hope it helps – it does for us! 😉
Resources
Let’s end with a couple of resources.
- Business Central Telemetry is the great work of Kennie Pontoppidan. Follow him here: Kennie Nybo Pontoppidan (@KennieNP) / Twitter!
- He and his team has put a lot of effort in documenting everything there is to document about Business Central Telemetry, which you can find here: Monitoring and Analyzing Telemetry – Business Central | Microsoft Learn.
- And let’s not forget about the samples they have put together on the BCTech GitHub repo here: BCTech/samples/AppInsights at master · microsoft/BCTech · GitHub.
- Last, and least 😉, there is my little sample repo on my GitHub: waldo1001/waldo.BCTelemetry (github.com). You can expect more and more samples there in the future, and who know, when I’m comfortable enough, I might be pullrequesting them to BCTech ;-).