
You might have seen it, you might haven even been there – but in any case: this year, at BCTechDays, I did a session about “Telemetry”. And since BCTechDays posts its sessions online (how unique is that!), you can watch the session here:
This post is NOT about the session, so I invite you to watch the session above, and give me some more views 🤪.
This post is about the tool I used to demo (the Azure Data Explorer) and the dashboard I made that you now can use yourself. Since the session, I massively improved and simplified the dashboard, which makes the “getting started” much easier.
So .. lets get started…
The scope
The goal of this blogpost is to give you a kickstart in analyzing your Telemetry with the Azure Data Explorer. You’ll see it’s similar to the PowerBI dashboard that Microsoft created, but very different for ad hoc analysis scenarios, where I find it much more efficient!
Quick introduction
The Azure Data Explorer (ADE) is actually made for analyzing “huge amounts of data” with KQL: it’s able to execute KQL in a query window, and it’s even able to save your collection of KQL queries in dashboards … and much more. See it as a collection of queries, that you can easily run (in parallel), and are always there at your disposal.
Now – Application Insights, where Business Central is sending its signals to, happens to be a big database, that we are able to query with the ADE. We don’t need to set up additional databases, synching with them or anything – just connect, and run queries to the online data – with the additional advantage over PowerBI: all your queries will always be the latest and greatest data!
Getting started
Easy:
- Browse to https://dataexplorer.azure.com/.
- Sign in
Signing in is important, because that’s going to be the account that you’ll use in your dashboards. So – pick the account that you have access to the Application Insights service as well!
Connecting to your App Insights
When you have signed in, on the left, you have the “Query” tab:

This Query window is very similar to the “Logs” in Application Insights: we can execute KQL on a database. But .. obviously, the first thing we need to do is set up that connection to that database. In our case: Application Insights.
To set up a connection, you’ll need a connectionstring, and for Application Insights, it’s pretty easy to set up – all you need is your Azure SubscriptionId being put in this format:
https://ade.applicationinsights.io/subscriptions/<YourAzureSubscriptionGuid>
To test it, just click Add/Connection, and set up your connection:
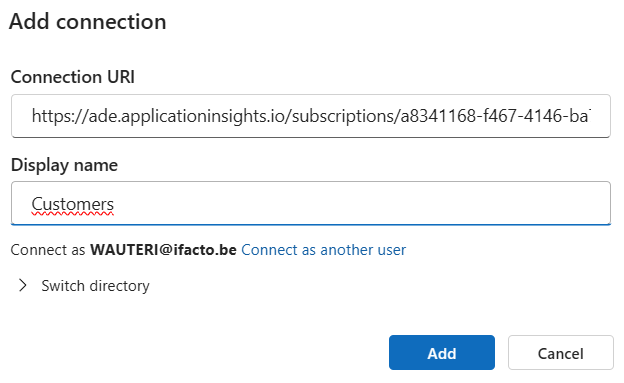
When connected, you get a list of all your AppInsights endpoints, and you’ll be able to execute queries, like you’re used to:

The key part is that connection string, because you’ll need it going further.
Setting up my dashboard
I’m not going to explain how to start from scratch – not saying you shouldn’t (see later). You’ll just find it much easier to have a good example before you’re starting to build your own.. trust me: KQL and Telemetry is all about Copy/Pasting ;-). And you’re about to paste about 100 queries in one go 🤪.
There are a few resources you might want tot start with. Just to name a few:
- waldo.BCTelemetry/Azure Data Explorer at master · waldo1001/waldo.BCTelemetry · GitHub
- DT.Telemetry/DirectionsNA2024/DT.ADE.Dashboard at main · duiliotacconi/DT.Telemetry · GitHub
- BCTech/samples/AppInsights/AzureDataExplorer at master · microsoft/BCTech · GitHub
I’m going to focus on what I know, which is mine (because that’s what I know best, obviously ;-)). Although, do know, you’ll learn a lot from all others as well!
I’ll use the “waldo.BCTelemetry Dashboard“. The way to import it, is simply:
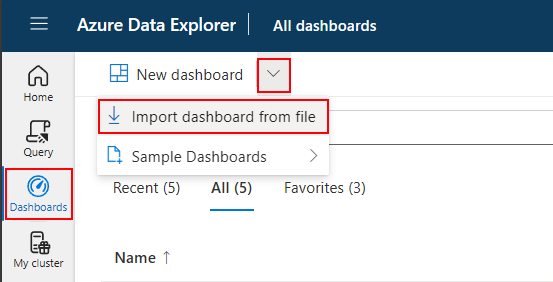
And use (copy/paste) the raw link:
Give it the name that you like
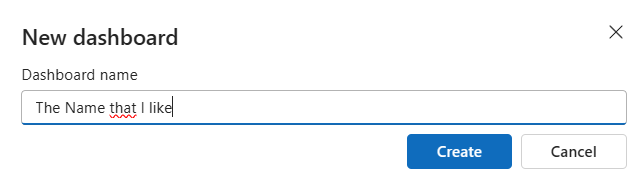
And done!
Now, you’ll see a dashboard all with errors. Simply because it has my connection, and you don’t have access.
To fix this, go to “Data Sources” and edit the "AI-Datasource", and paste the same URI that you already has set up above, Connect and select the database you want to analyze with this dashboard.

The base queries
I already made some base queries for you, and it’s important to understand.
A base query is actually a variable that you can use in your dashboard, that you “pre-fill” with data, so that you don’t have to do the same things all over the place.
I created 2 for you:
- allTraces: very similar to “traces”, but already filtered with a bunch of parameters that I have set up, extended with a bunch of columns, and so on. Too much to explain, just have a look, and be amazed 🤪.
- entraTenantIdDescriptions: this is a call to external data, which you can use to make it easier to identify your customers. I’ll “join” this with the “aadTenantIds”, and you get “TenantDescriptions” for free in all the tiles in the dashboard.
Setting up these tenantDescriptions, I can’t do that for you, obviously. That’s why you see this in the “Base Tables” tile:

When you check out the base query, you’ll see it points to this file:
The idea is: you create your own file, and make it available so that the dashboard can download it – and obviously change the base query to your own URL. Me personally, I simply use dropbox 🤷♂️. But you can do whatever you want. Make sure the format is the same. You don’t have to, but it is a small effort, and it makes the dashboard very much more readable. On top of that, you get a simple parameter to simply filter all the entire dashboard for one customer, if necessary.
Parameters
When you go to the Parameters, you’ll see that I already have a bunch of parameters. Just browse through them, to see if they make sense. Most of these, I already use in the Base Query “allTraces“, so there isn’t really anything you should change, they are “just” used already ;-).
But – you can also add your own. There are enough examples for you to start from, I’d say ;-).
You are done!
This is it. You did all that was necessary to make it work. Now, it’s up to you to start analyzing whatever you like.
Clean up
You’ll see there are some “CT” tabs in the dashboards. “CT” stands for “Custom Telemetry”. When you look at the BCTechDays session, you’ll see what that means, but chances are you don’t have this telemetry, or you have different eventIds. So please feel free to delete or change however you see fit.
Tip: there are settings
Don’t forget you can set up your environment when you click settings on the top right
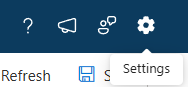
Here, you can set the time zone, zo your timestamps will be in your time zone, and not UTC. Very useful! I invite you to check the other settings to make the experience more “your own”!
Another tip: start from scratch
No matter how much I want yo to use my dashboard, I don’t think you should do just that. I think it’s interesting to see it as a starting point, but you know, there are not “updates”, there is no branching, no version control, no forking, nothing of the sorts. As such, you basically just copied my dashboard and made it your own. Whatever update I do, you won’t get, and whatever update you do, will be overwritten when you import a new version of my dashboard.
What I would suggest is, look at my (and other people’s ) dashboards as a reference, but start one from scratch, for yourself. You take full control, manage it yourself, and that’s your go-to board. But also set up some dashboards of mine, Duilio or anyone else, just as a reference, to copy from to your own, when necessary. I personally think that would be a good workflow.
6 comments
1 ping
Skip to comment form
I have installed, tweaked, and shared the dashboards!
It’s a good inspiration on how to do different visual output with different queries.
The one of drawbacks I have experienced is that when you go into edit mode of the KQL it keeps the previous dynamic filters into the edit mode even if you change the dynamic filters in the edit mode. Hopefully, a temporary bug. That took me some hours to figure out.
Another drawback is that I thought it was possible to create building block base queries that could contain only filters. But it seems that each base query needs to start with data input. You can’t start a base query with | .
Example
MyBaseData
| // Base Query
| // Base Query
When I shared the dashboard the users needed to have access to both dashboard AND the application insights.
Author
You can combine base queries – which I do in my latest dashboard on this blog.
About sharing the dashboard:
well yeah, you’re not sharing the data, you’re sharing the queries – the users you are sharing it with, still need to run the query to get the data. It’s what makes sharing safe, no?
Yeah I know because I dissected them 😉
Example of base queries:
_Data:
traces
| union pageViews
_DataDynamicFilter:
_Data
| where timestamp between (_startTime .. _endTime)
| where customDimensions has_any (_eventId)
| where message contains _MessageFilter
| where tostring(customDimensions.componentVersion) startswith _componentVersionFilter
I don’t like the last query, DataDynamicFilter. Because it has Data has dependency. I would rather have done it like this
_DynamicFilters
where timestamp between (_startTime .. _endTime)
| where customDimensions has_any (_eventId)
| where message contains _MessageFilter
| where tostring(customDimensions.componentVersion) startswith _componentVersionFilter
But how do I combine such a filter?
Currently it doesn’t seem to support the following:
IsEmptyDynamic:
_Data
| _DynamicFilters
| IsEmptyFilters
It seems like a base queries are made so you always have to specify input data + filters/operations but you cant create a base query with no input and just filters.
What I’m interested in is creating ONE base query for ex. doing the filters for showing IsEmpty that locks.
Currently I have to do two base queries, one with dynamic filters and one without and the rest of my queries has to be based on those two which gives that I get two IsEmpty queries instead of one.
Nice work!
Is there a way to maintain the content of entraTenantIdDescriptions directly in the Dashboard instead of having a file placed somewhere on the open internet with a list of customers (not that GPR complient IMO) – if so, can you provide a dummy example?
Author
Not sure – but I think Azure Blob Storage with Impersonation should work?
https://learn.microsoft.com/en-us/azure/data-explorer/kusto/query/externaldata-operator?pivots=azuredataexplorer
https://learn.microsoft.com/en-us/azure/data-explorer/kusto/api/connection-strings/storage-connection-strings
It works – I just uploaded the file to Azure Blob Storage and via Azure Storage Explorer I right-clicked on the file and used the “Get Share Access Signature…” option to create an URI that can be used in the Dashboard 😉
[…] Handling Business Central Telemetry like a boss: my Azure Data Explorer dashboard […]