
I recently had a very scary thing happening on our Telemetry setup, that I would have never expected, and was glad I was able to catch it in time.
TL;DR
Any extra action on your Business Central environment can cause an explosion of telemetry signals, which possibly turns into an insane Azure bill. Therefore, it’s important to monitor and analyze your Telemetry usage, so you can take action before it’s too late.
A story …
Not too long ago, we were analyzing our costs of Telemetry. We have about 40 customers on Telemetry, and we were paying about 1000 EUR per month for having this data. That’s about 25 EUR per customer, which is ok, but we also wanted to analyze which events were the most used events – and may be cut down if it would be useless to us.
So we did.. .
At that point in time we had about 10 million events per day, quite stable, where most of the events were pretty much the same..:
- Successful authentication
- Successful API calls
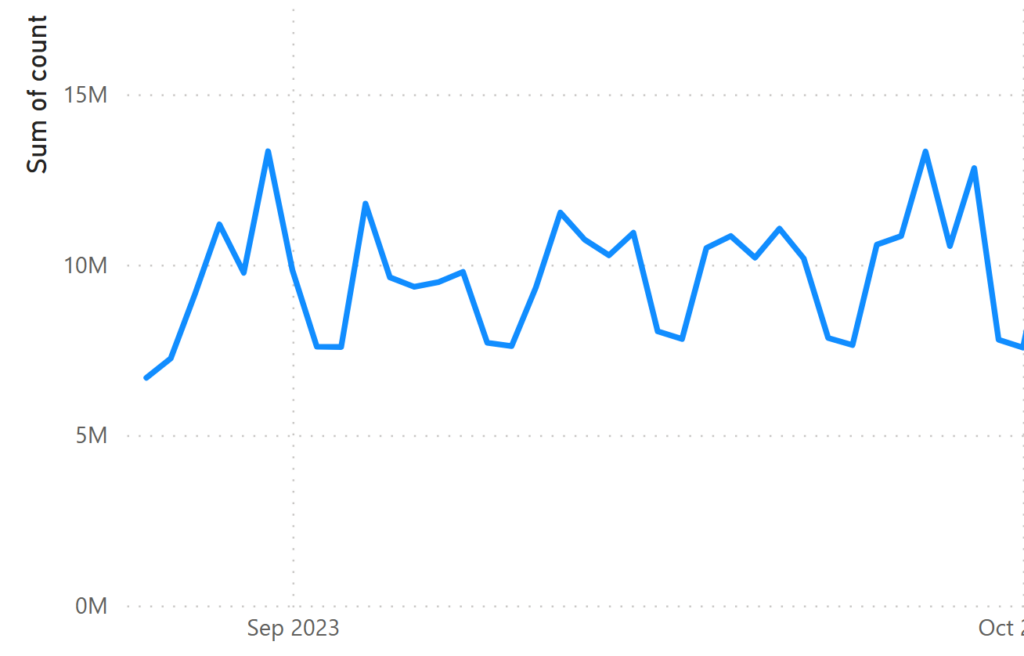
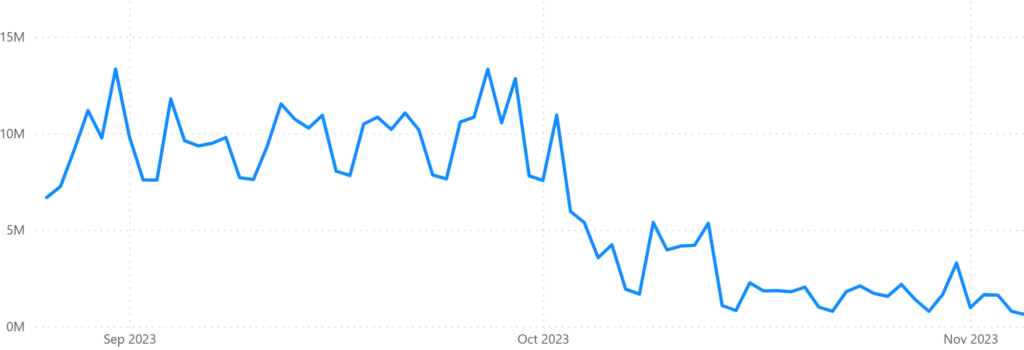
Now – I don’t know about you – but we never really looked into these signals, so I decided to first take the authentication-signal out, and a week later, the other one. And I was going to monitor it. It clearly had a huge impact, as you see the usage going down significantly:
Now, this was also the time I was preparing for my session at Directions EMEA about Telemetry. Where I was also investigating options to not only report on “stuff” in Telemetry, but also getting alerted about them: like getting alerts when something out of the ordinary happens.
For “Telemetry usages”, that’s simple: when this value gets too high, I’d like to have an alert. I decided to build a PowerBI report, and use “Metrics” to alert me of anything that I defined “not good”.
And oh boy was I glad.
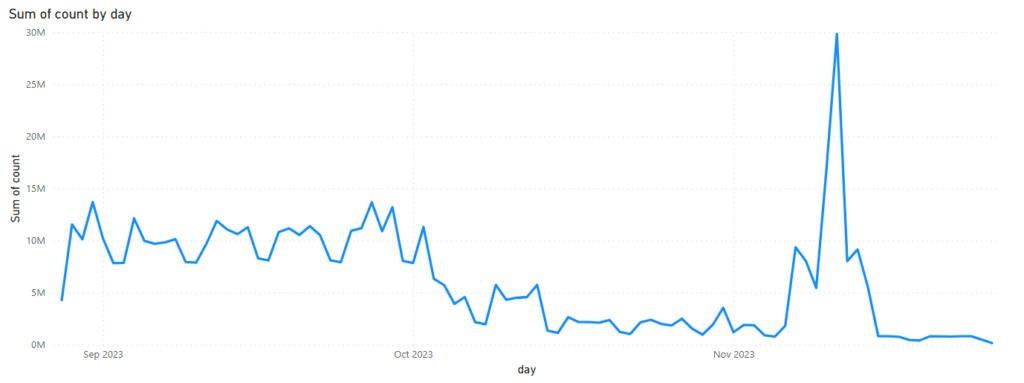
Because – on a certain day not too long ago – this happened:
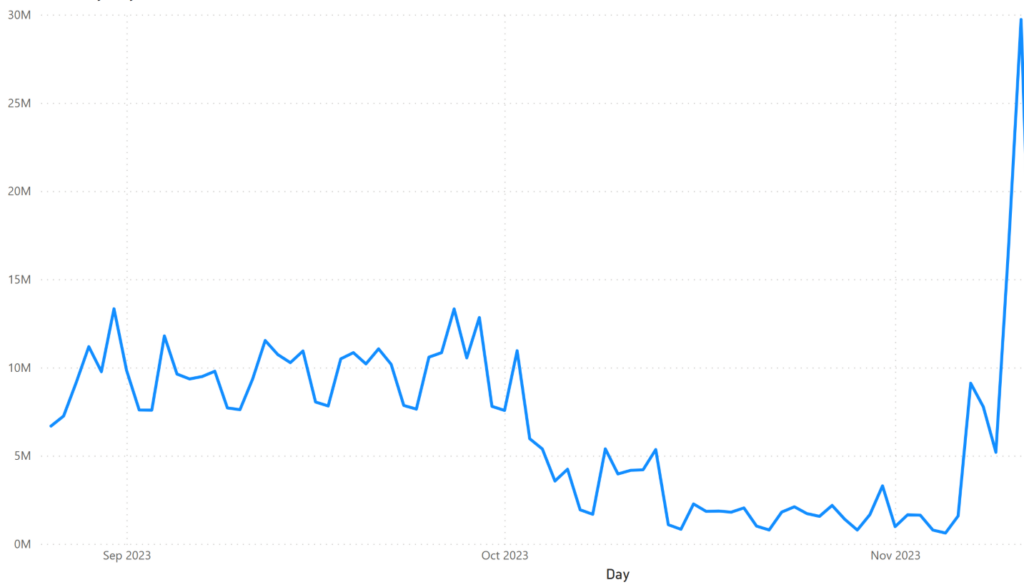
Exactly: a peak of 30 million signals all of a sudden.
Crazy
Now – get this.
After investigation (which was easy because all info is just “there” ), it was because the customer created a new report in Jet Reports, that caused about 8 million ODataV4 calls (a signal I didn’t switch off) each time they would run the report – because the report was built on the Value Entry table.
And – they scheduled to run this report daily. DAILY!
The reason why this day, it was 30M signals was because they were building and testing the report. But it would have ended up with about 10M extra calls a day, which kind of means that this customer would have cost us (the partner that was monitoring them with Telemetry) about 1000 EUR a month – just because he created a report.
Crazy.
Scary!
And I was happy to catch it, so we only were in this situation for 1 day.
So – how did I do that? Well – let me shortly describe that with the tools I used.
KQL
Well, first of all, I created a simple query to show me the total amount of events per day:
//Usage By Day
traces
| where timestamp >= ago(30d)
| where isnotempty(customDimensions.eventId)
| extend day = format_datetime(timestamp,"yyyy-MM-dd")
| summarize count = count() by day
| order by day desc
Remark: These KQL queries are always a work-in-progress – so you can find latests version on my github. The “Usage”-queries, you can find here: https://github.com/waldo1001/waldo.BCTelemetry/tree/master/Usage
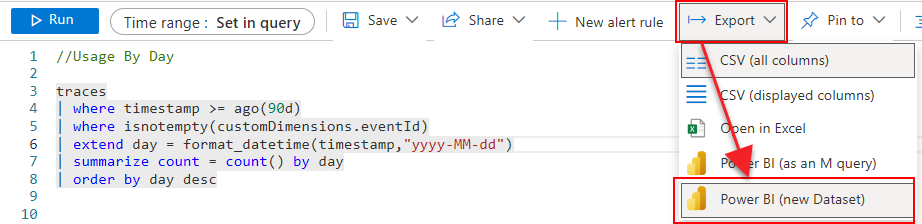
PowerBI
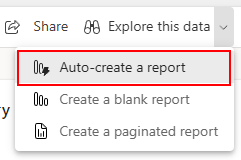
Next, I created a simple report in PowerBI. The most easy way to do that, is to export the KQL query as a dataset in PowerBI:
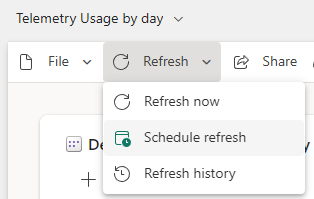
Next, I make sure to refresh it every day:
Make sure you change the data type of the “Day” field to something useful (the KQL will create it as string – which obviously doesn’t make sense. Open the data model of the dataset in powerbi, where you can change the datatype of the field).
Then, I created the simplest report ever – which is probably the only thing I’m capable of.. 🤪
Now, you have a graph that shows the amount of telemetry signals by day. Something like:
That’s cool and all – but I bet you don’t want to make it into a habit to look at it every day.
Metrics
That’s where these “PowerBI Metrics” come into play. What are Metrics? Well – in Power BI, the Metrics function empowers users to customize and track their metrics in a unified dashboard. It basically makes “data-changes” more visible for users or teams.
More info here: Get started with metrics in Power BI – Power BI | Microsoft Learn
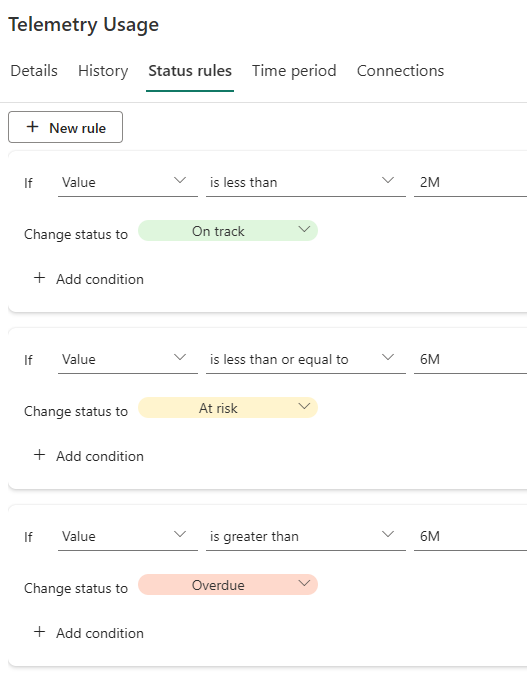
I simply created a metric and connected the values to the report that I just created. On top of that, I set up status rules so I can track the different statuses that I think make sense:
AND .. I made sure I “follow” the metric:
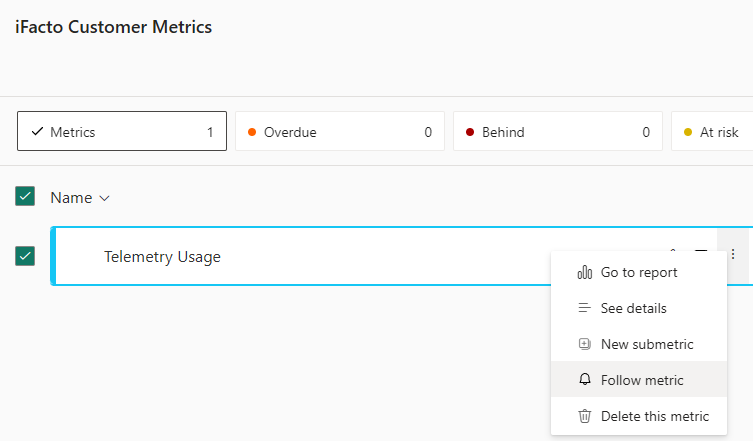
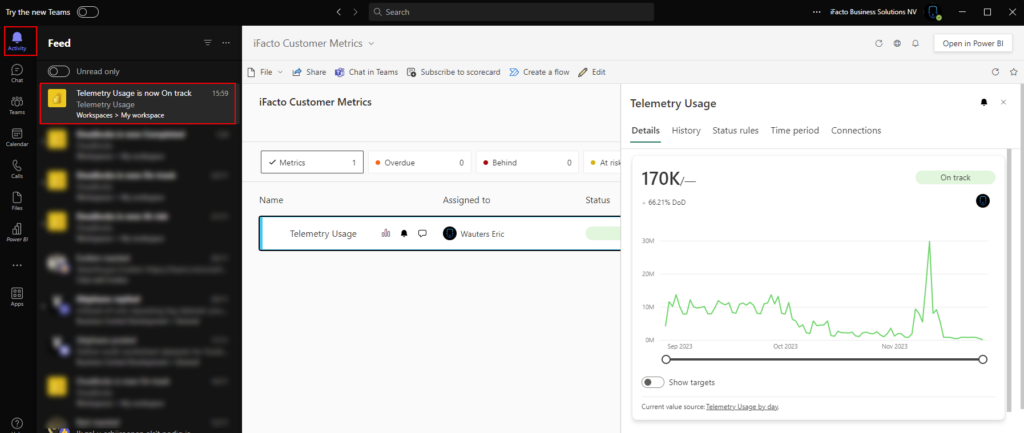
From documentation: “Once you follow a metric, you’ll get Teams notifications whenever the metric definition is updated, a check-in is added, or an automated status rule changes the status of the metric. “
The latter is exactly what I’m after: whenever the usage is not “On Track” anymore – let me know! And since I’m using Teams every day – let me know in Teams ;-).
Data Collection Rules
Last piece of information you might wonder about, might be how to cut down on the Telemetry costs. Well, I used “Data Collection Rules”. You can find more here: Telemetry FAQ (Frequently Asked Questions) – Business Central | Microsoft Learn.
Also Tomáš Kapitán did a very nice blogpost about it, that goes more in detail on his internal usage of DCRs: Use Transformation Rules to lower the costs of BC Telemetry | MSDyn365 Business Central – Tom Kapitan (kepty.cz)
For now, I kept my DCRs far too simple. So I don’t want to share just yet .. but with the mentioned link, you can at least get started yourself ;-).