
Here’s a small blogpost about an undocumented, but not uninteresting “feature” (at least not in my book ;-)).
Performance Profiling
You’re probably very much aware of the Performance Profiler in Business Central: an ability to monitor code execution in terms of “durations” and “hit count”, and having a view on how the code/process performed.
As a first version, we had in v19 the AL Performance Profiler where we could profile from VSCode, and analyze the result in VSCode as well. Awesome tool, which looks something like this:
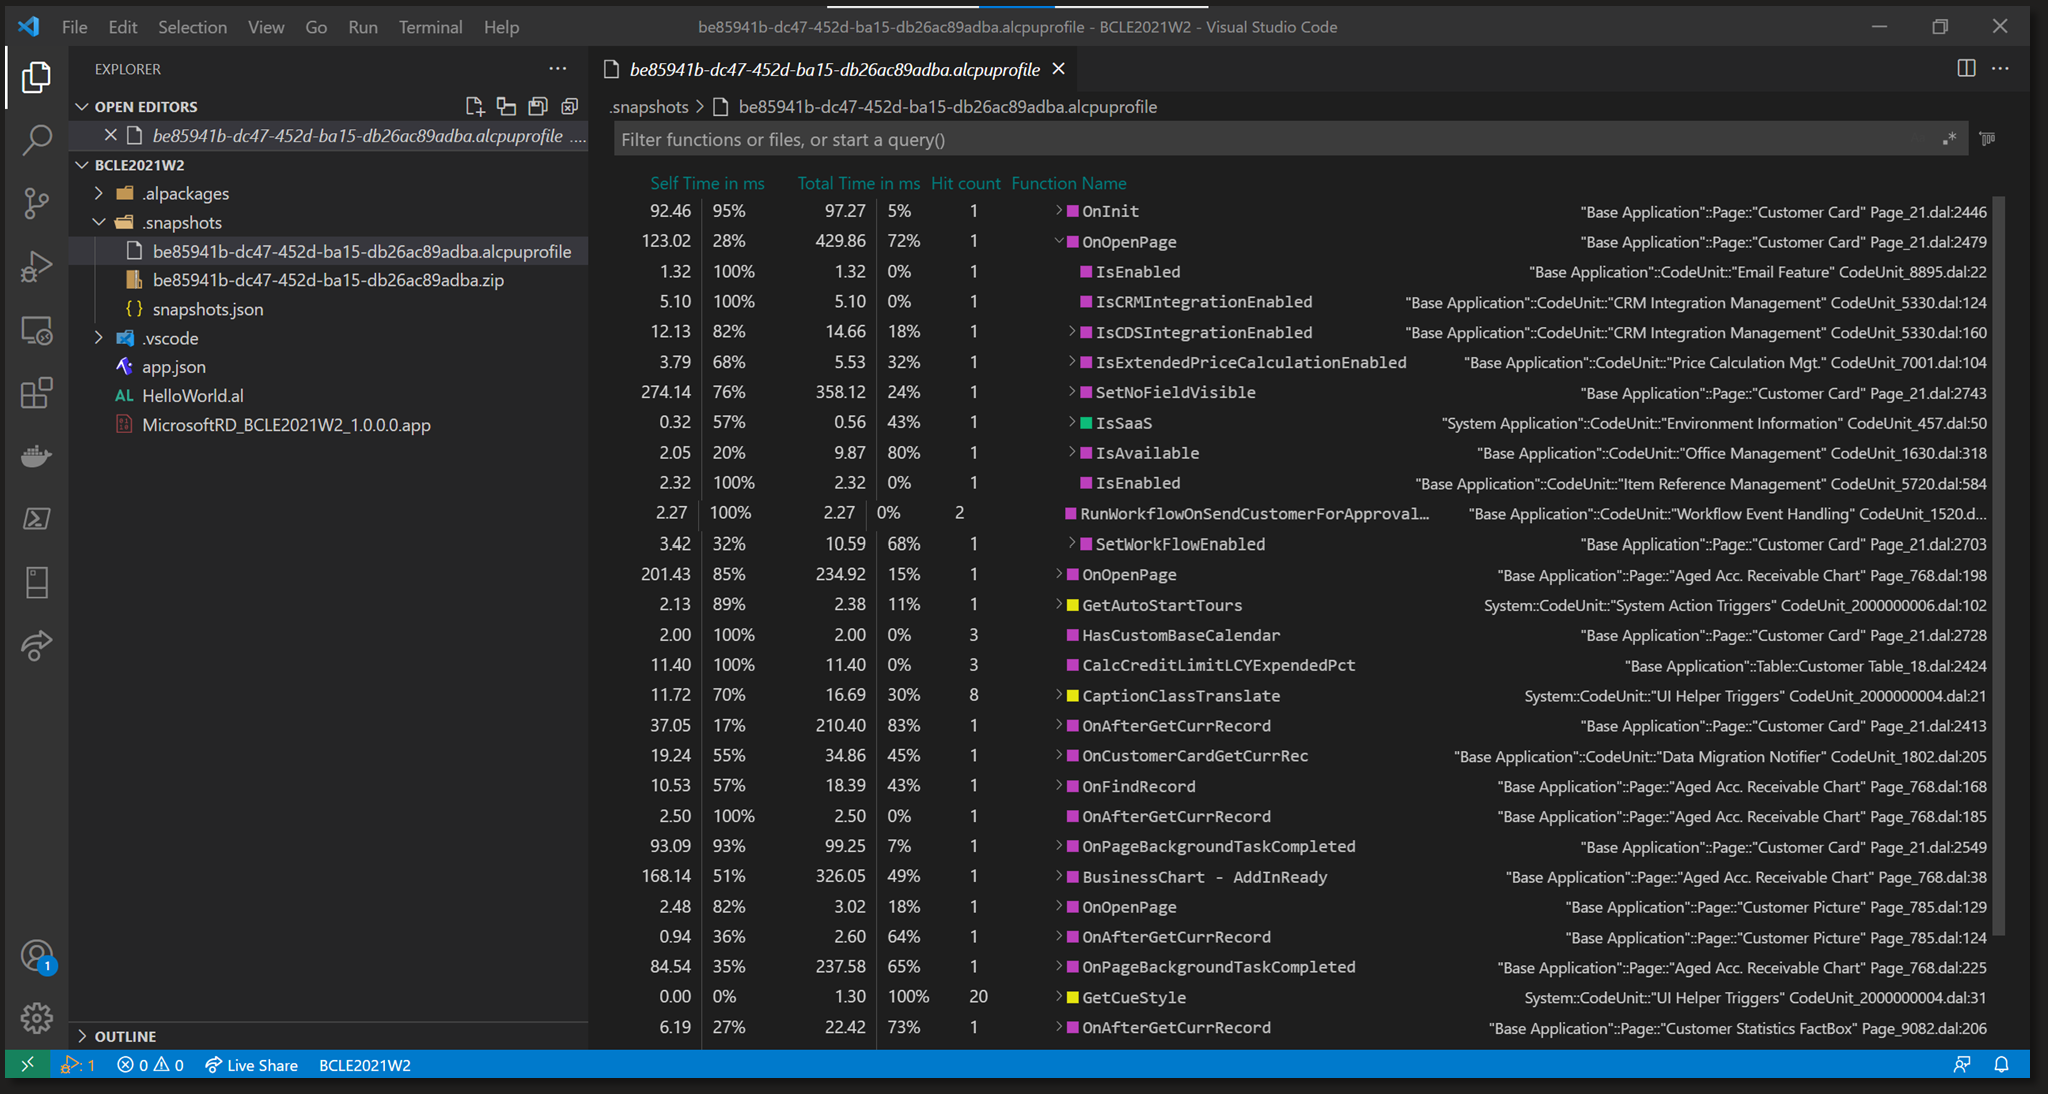
You can find more information here: AL Profiler Overview – Business Central | Microsoft Learn
And – since v20 – we even have a new ability that the user can do pretty much the same in the client – which we call the “In-Client Profiler“, which looks like this:

More info about this: In-client performance profiler – Dynamics 365 Release Plan | Microsoft Learn
While both tools looks very similar, the mechanics behind the scenes work very differently. The AL Profiler can use (and does use by default) what we call “Instrumentation“, while the In-Client profiler will always use “Sampling“.
Instrumentation
Instrumentation is the process of injecting code into each of the methods that need to be analyzed – basically all methods in AL. It basically comes down to the fact that when profiling, Microsoft injects code before and after pretty much every single procedure:

Thanks to this added code, they can monitor duration, hitcount and so on of every single method.
Sampling
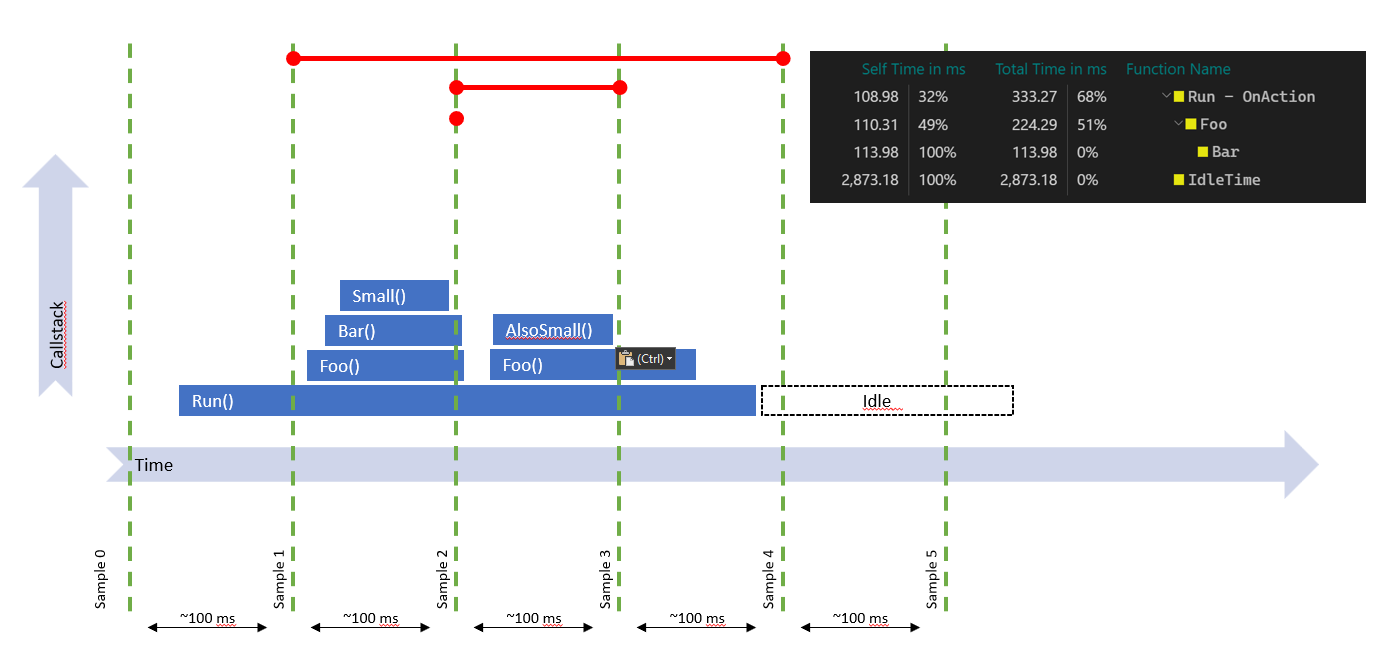
Sampling doesn’t inject anything – it’s basically a separate process that runs side-by-side with the profiled application, which “peeks” at intervals at the callstack and will log that state at that time with the interval being the duration.. . If you look at this picture, it would take a peek every 100ms – and result in the pictured profile.
The problem with Sampling
What you can also see in this picture is that while the callstack is executing a depth of 4 methods, the profile is losing some data, simply because the callstack was not executing that depth when the sampling-interval “peeked” and logged that current state. Meaning: with sampling, you might lose data when the method’s duration is shorter than the sampling interval (look at the “small()” method for example).
In Business Central, this Sampling Interval is set to 100ms by default.
In my book, this is very high. If you have 90ms methods, I’d really like to know, but I might not catch them in my profile output.
So – question is – can we DO something about that? And to quote Obama: “yes, we can“. But it’s a bit tricky, because you won’t find anything in any settings file or with PowerShell out-of-the-box. But – you CAN set (and therefore add) a setting with PowerShell to the CustomSettings.config with:
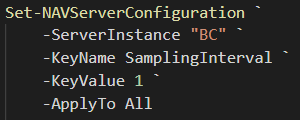
The setting does exist and it does work. And it will make sure the sampling process will catch much more than when the default 100ms is being used.
Yes – OnPrem only. There is no way to set this on SaaS..
When should we change this setting, and when not?
Well – I’m not going to claim you should set this to 1 in every single environment – rather the opposite. When profiling, it does cause an overhead, and you don’t want that on LIVE environments. How much? I don’t know – but I wouldn’t want to just set this on Production environments by default.
BUT
When you’re setting up an environment where you specifically are looking into performance scenarios – or in a debug-copy of your live environment .. or any other sandbox .. why not? 🤷♀️
Use with caution ;-).
2 pings
[…] Setting the Sampling Interval for (in-client) performance profiling Business Central […]
[…] Source : Waldo’s Blog Read more… […]